


Climate Change (Disclosure in Accordance with TCFD)
On the issue of climate change, the IPCC 6th Assessment Report in 2023 noted that there is “no room for doubt” that human activities have caused global warming, emphasizing the urgent need to reduce GHG*1. The world has been pursuing initiatives since 2020 under the Paris Agreement, and in response to the Glasgow Climate Pact established at the 2021 United Nations Climate Change Conference (COP26), the international community has made a significant change in direction toward the 1.5ºC goal – namely to achieve carbon neutrality by 2050.
At the Mitsubishi Materials Group, we also take the issue of climate change seriously, in keeping with our Corporate Philosophy of “For People, Society and the Earth.” We have set our target year for achieving carbon neutrality to the fiscal year ending March 2046, five years ahead of Japan’s national target year of the fiscal year ending March 2051. Additionally, by the fiscal year ending March 2051 we aim to achieve renewable energy generation comparable to the power we consume internally, resulting in an effective 100% self-sufficiency rate for renewable energy. In these ways, we will continue to pursue business activities aimed at realizing a decarbonized society.
The Group supports the Energy Conservation Act,*2 the Global Warming Prevention Act,*3 other laws and regulations, and NDC of Japan, and it is reducing its energy use and GHG emissions.
- GHG: Greenhouse gas
- Energy Conservation Act: Act on Rationalization of Energy Use and Shift to Non-fossil Energy
- Global Warming Prevention Act: Act on Promotion of Global Warming Countermeasures
In March 2020, the Group decided to endorse the recommendations of the TCFD*4 and participate in the TCFD Consortium, which consists of companies, financial institutions and other organizations which support those recommendations. We will appropriately disclose the impact (risks and opportunities) of climate change on the Group’s business operations and the results of analyzing that impact in line with the TCFD recommendations.
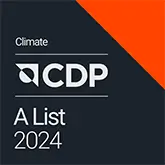
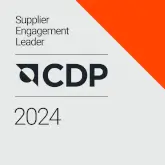
The Group answers questionnaires for the CDP (a non-profit organization) on a yearly basis. On an 8-step scoring from A to D-, in the fiscal year ended March 2025, we achieved an “A List,” the highest rating in the CDP Climate Change Assessment for the first time, and a “B” in the CDP Water Security Assessment. We were also recognized as the “Supplier Engagement Leader” in the CDP Supplier Engagement Rating. For details, please see the following link.
- TCFD: Task Force on Climate-related Financial Disclosures. The TCFD was established in 2016 by the Financial Stability Board, an international organization that seeks to stabilize financial systems.
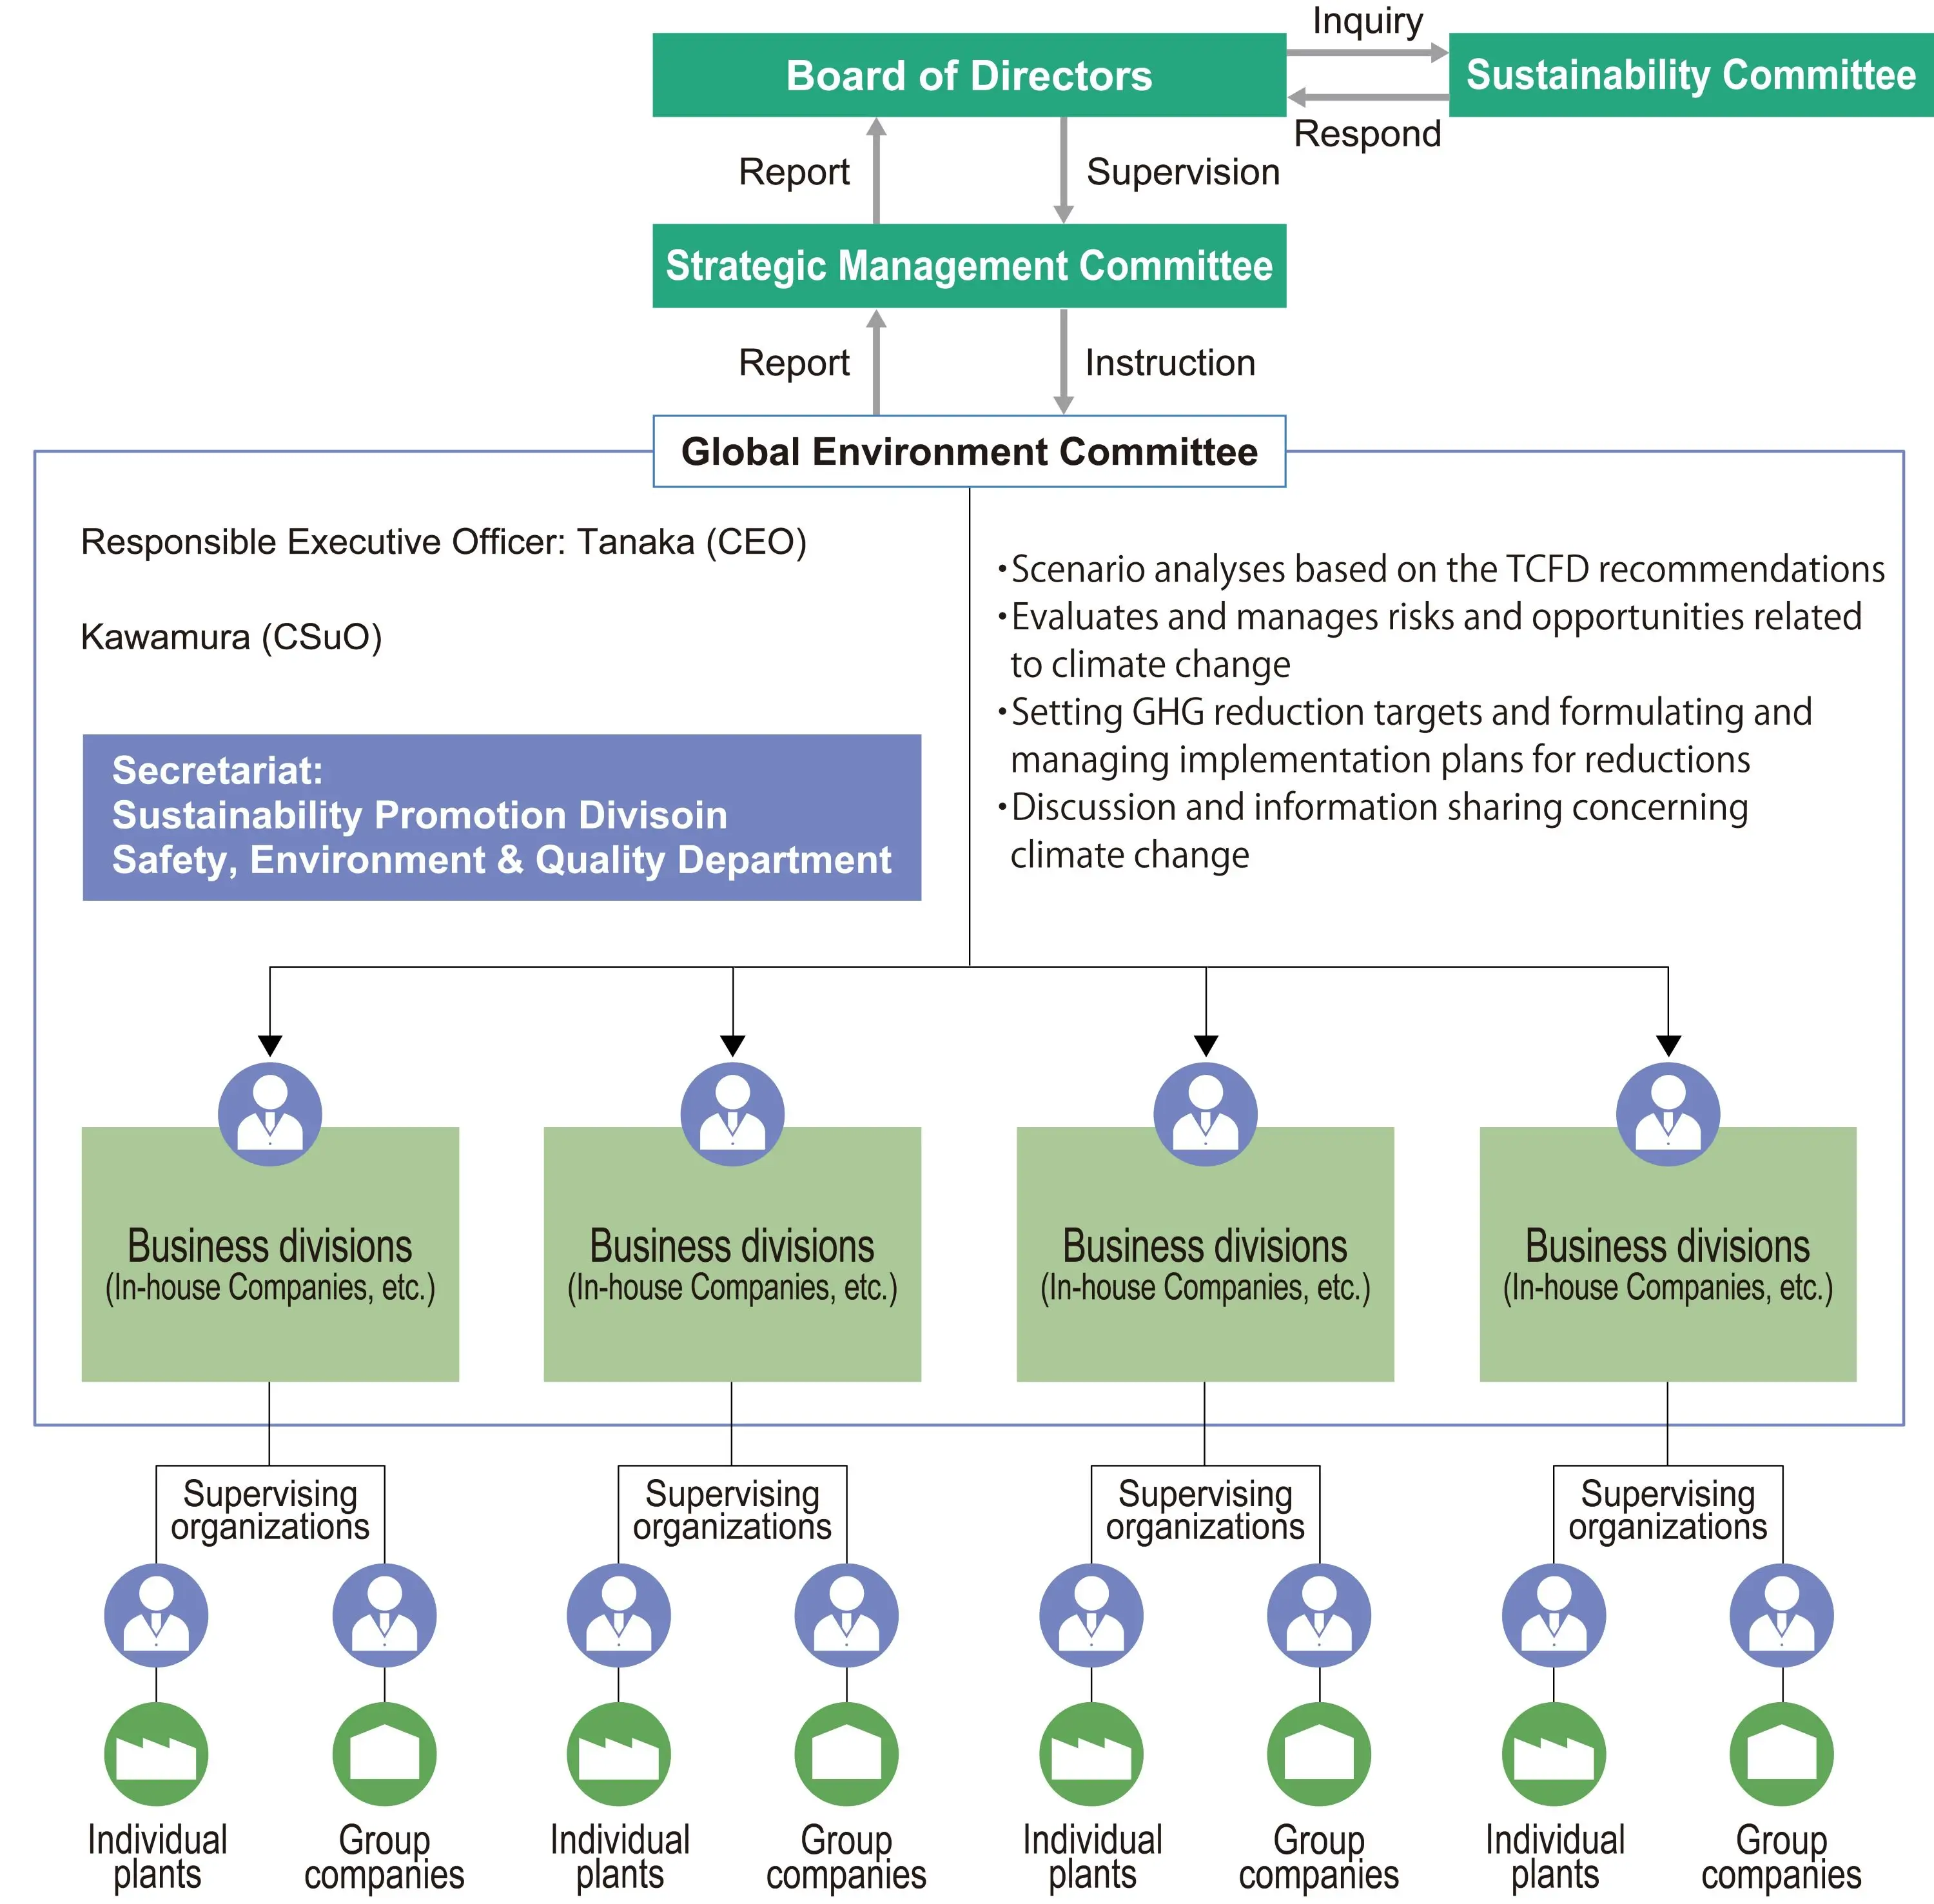
We have appointed an Executive Officer (CSuO) in charge of responding to Sustainability issues, including addressing climate change, and we are acting proactively. We have also established a Global Environment Affairs Department of the Corporate Division to plan and promote the Group’s strategic initiatives for risks and opportunities related to climate change. The Global Environment Committee, for which the Safety, Environment & Quality Department of the Sustainability Promotion Division serves as secretariat, conducts scenario analyses based on the TCFD recommendations, evaluates and manages risks and opportunities related to climate change, sets GHG reduction targets, formulates and manages action plans to reduce GHGs, and engages in other discussion and information sharing concerning climate change. In addition, activities are reported to the Strategic Management Committee and the Board of Directors for appropriate monitoring. (Matters for deliberation by and reporting to the Strategic Management Committee and Board of Directors)
- Greenhouse gas emission reduction target setting and reduction plans
- Climate change-related information for disclosure
- Assessment of climate change-related risks and opportunities for each business
Further, we have established the Energy Management Subcommittee, which is jointly managed by the Monozukuri and Corporate Production Engineering Department of the Manufacturing and R&D Strategy Division and the Safety, Environment & Quality Department, as a meeting body that manages the actions taken to achieve the GHG reduction targets set by the Global Environment Committee. The Energy Management Subcommittee shares examples of initiatives, supports the introduction of equipment, and carries out other activities to push forward with the reduction of plants’ energy usage.
The Board of Directors goes beyond the monitoring of sustainability initiatives. The Sustainability Committee, an advisory body to the Board of Directors, was established to actively consider the direction of sustainability efforts from different perspectives and present its findings internally. The committee monitors the Company’s action related to climate change, considers the methods and issues involved, and reports its findings to the Board of Directors.
In March 2021, based on the recommendations of the TCFD, we conducted scenario analyses to ascertain the impact (risks and opportunities) that climate change has on the Group’s business operations and consider measures aimed at mitigating the risks and capitalizing on the opportunities.
With regard to transition risks and opportunities, in February 2023 we updated our scenario analyses while maintaining consistency with the Medium-term Management Strategy FY2031, and set business indicators and targets. We set themes and analyzed them in the 1.5ºC and 4ºC scenarios. As a risk that is common to all business operations, we estimated the financial impact on the Group in the event that policies and legislation on climate change were stepped up, and carbon pricing was introduced and strengthened. We also analyzed the impact on our business operations in terms of risks and opportunities with regard to the shift in EV demand, changing forms of energy use, and changing demand for the recycling business due to the shift to a recycling-oriented society. Further, in terms of physical risks, in our Group-wide risk management activities we also manage water risks including damage from acute and chronic risks including torrential rain, flooding, storm surges and droughts thought to have materialized in relation to climate change.
For details about our scenario analysis results, please refer to the section on “Climate Change-related Risks and Opportunities.”
In addition, an ICP system has been introduced since the fiscal year ended March 2025 to raise awareness of GHG emissions within the company and to further promote decarbonization efforts.
Results of climate change scenario analysis, the Mitsubishi Materials Group recognizes that climate change risks are one of the key risks that could have a significant impact on the Group’s business performance and financial condition, and drives initiatives to address these risks within its risk management activities.
The implementation of risk measures is discussed and monitored by the SCQ Promotion Division and the Strategic Management Committee.
At these meeting bodies, the CSuO is responsible for implementation and operates independently of the Audit Committee. The Board of Directors also verifies and reviews the effectiveness of the risk management process and comprehensively oversees risk management.
For more details about the Group’s risk management system, operating status and the selection process for major risks, please refer to the section on “Risk Management.”
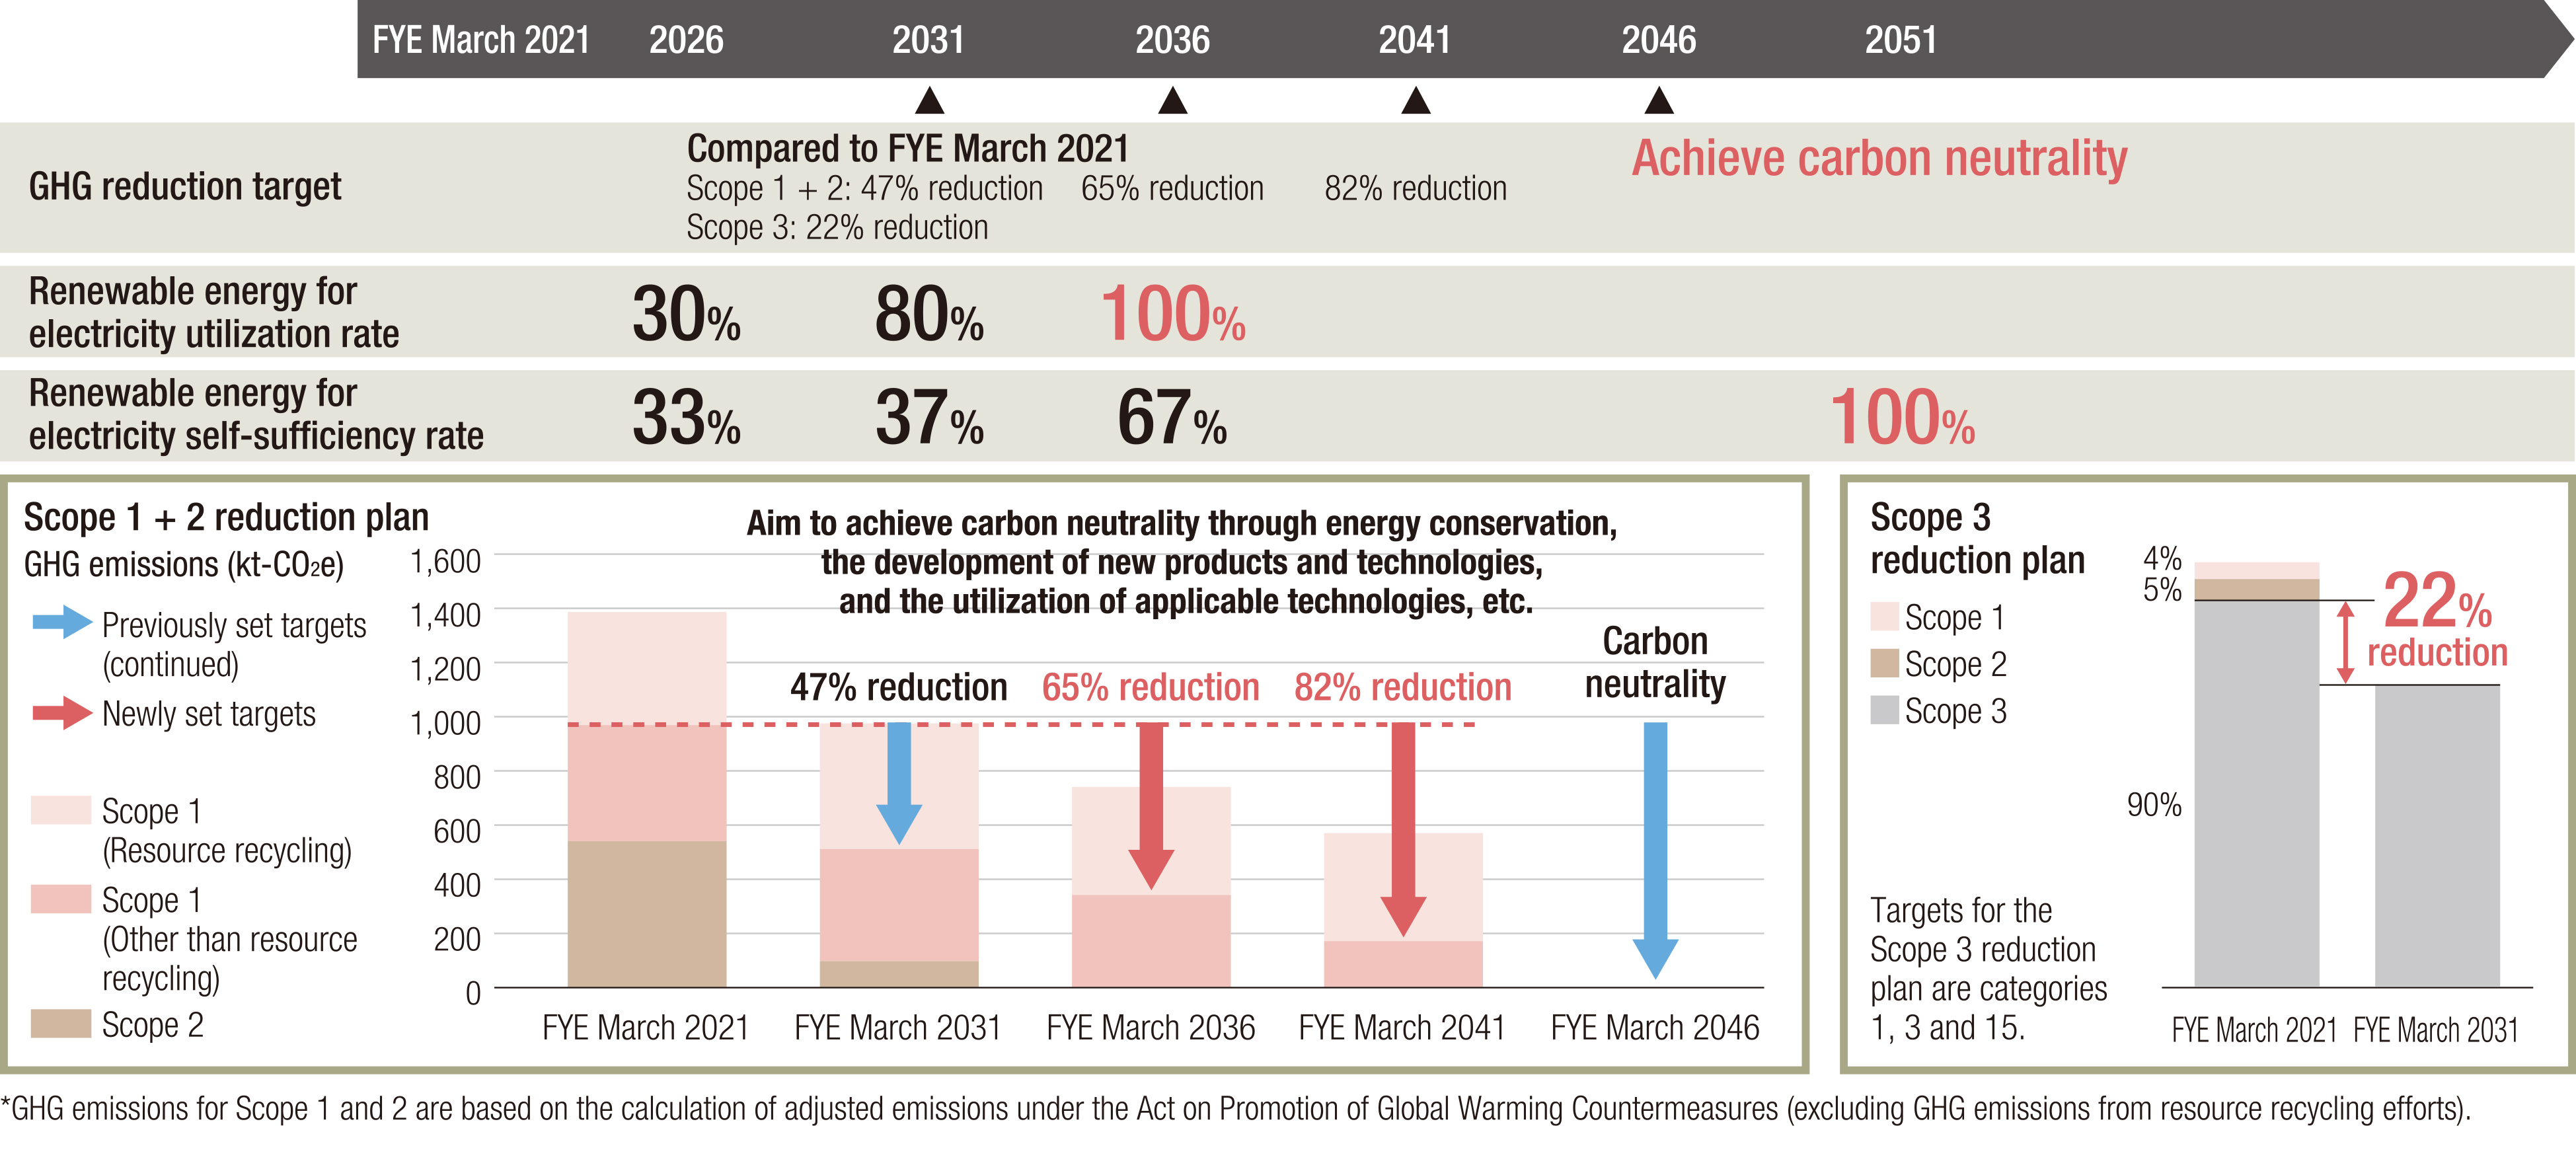
The Group has revised its GHG emissions (Scope 1 + Scope 2) reduction target to be set for emissions excluding GHG emissions from resource recycling efforts.
With the start of periodic reporting in the fiscal year ended March 2024 based on the revised Act on Rationalization of Energy Use and Shift to Non-fossil Energy (hereinafter referred to as "Energy Conservation Act") and the Act on Promotion of Global Warming Countermeasures (hereinafter referred to as "Global Warming Prevention Act"), both of which were revised in 2022, we have reorganized our GHG emissions based on these laws and regulations, and added GHG emissions from the combustion of plastic contained in E-Scrap and CO2 generated from the chemical reaction of limestone used in the manufacturing process, which were previously excluded from the scope of calculation and reporting, have been added to the scope of reporting under both laws and regulations*5.
Since we have set "For people, society and the earth, circulating resource for a sustainable future" as Our Commitment and have made strengthening resource recycling by leveraging the strengths of our business a pillar of our Medium-term Management Strategy, we have set a new GHG reduction target of GHG emissions from our resource recycling efforts of emissions*6 excluding GHG emissions from resource recycling efforts, we have set a new GHG reduction target of a 47% reduction*7 from the fiscal year ended March 2021 level by the fiscal year ending March 2031.
Furthermore, in addition to the existing targets for the fiscal years ending March 2031 and 2046, and taking into account Japan's Nationally Determined Contribution (NDC) established by the Japanese government in February 2025, new Scope 1 (GHG emissions excluding emissions from resource recycling initiatives) emission reduction targets for the fiscal years ending 2036 and fiscal 2041 have been set based on the figures on the slope of the line connecting the targets for the fiscal years ending March 2031 and 2046. Targets set for total Scope 1 (GHG emissions excluding emissions from resource recycling initiatives) and Scope 2 are a 65% reduction by the fiscal year ending 2035 and an 82% reduction by the fiscal year 2041 compared to the fiscal year ended March 2021.
In addition to the GHG emissions reduction target, we have also set the goals of achieving 100% utilization of renewable energy for purchased electricity by the fiscal year ending March 2036 and 100% self-sufficiency in renewable energy for electricity by the fiscal year ending March 2051 by promoting the development and expansion of utilization of renewable energy sources such as geothermal power generation, in which the Group has strengths. In order to achieve these targets, we are working to achieve the following goals.
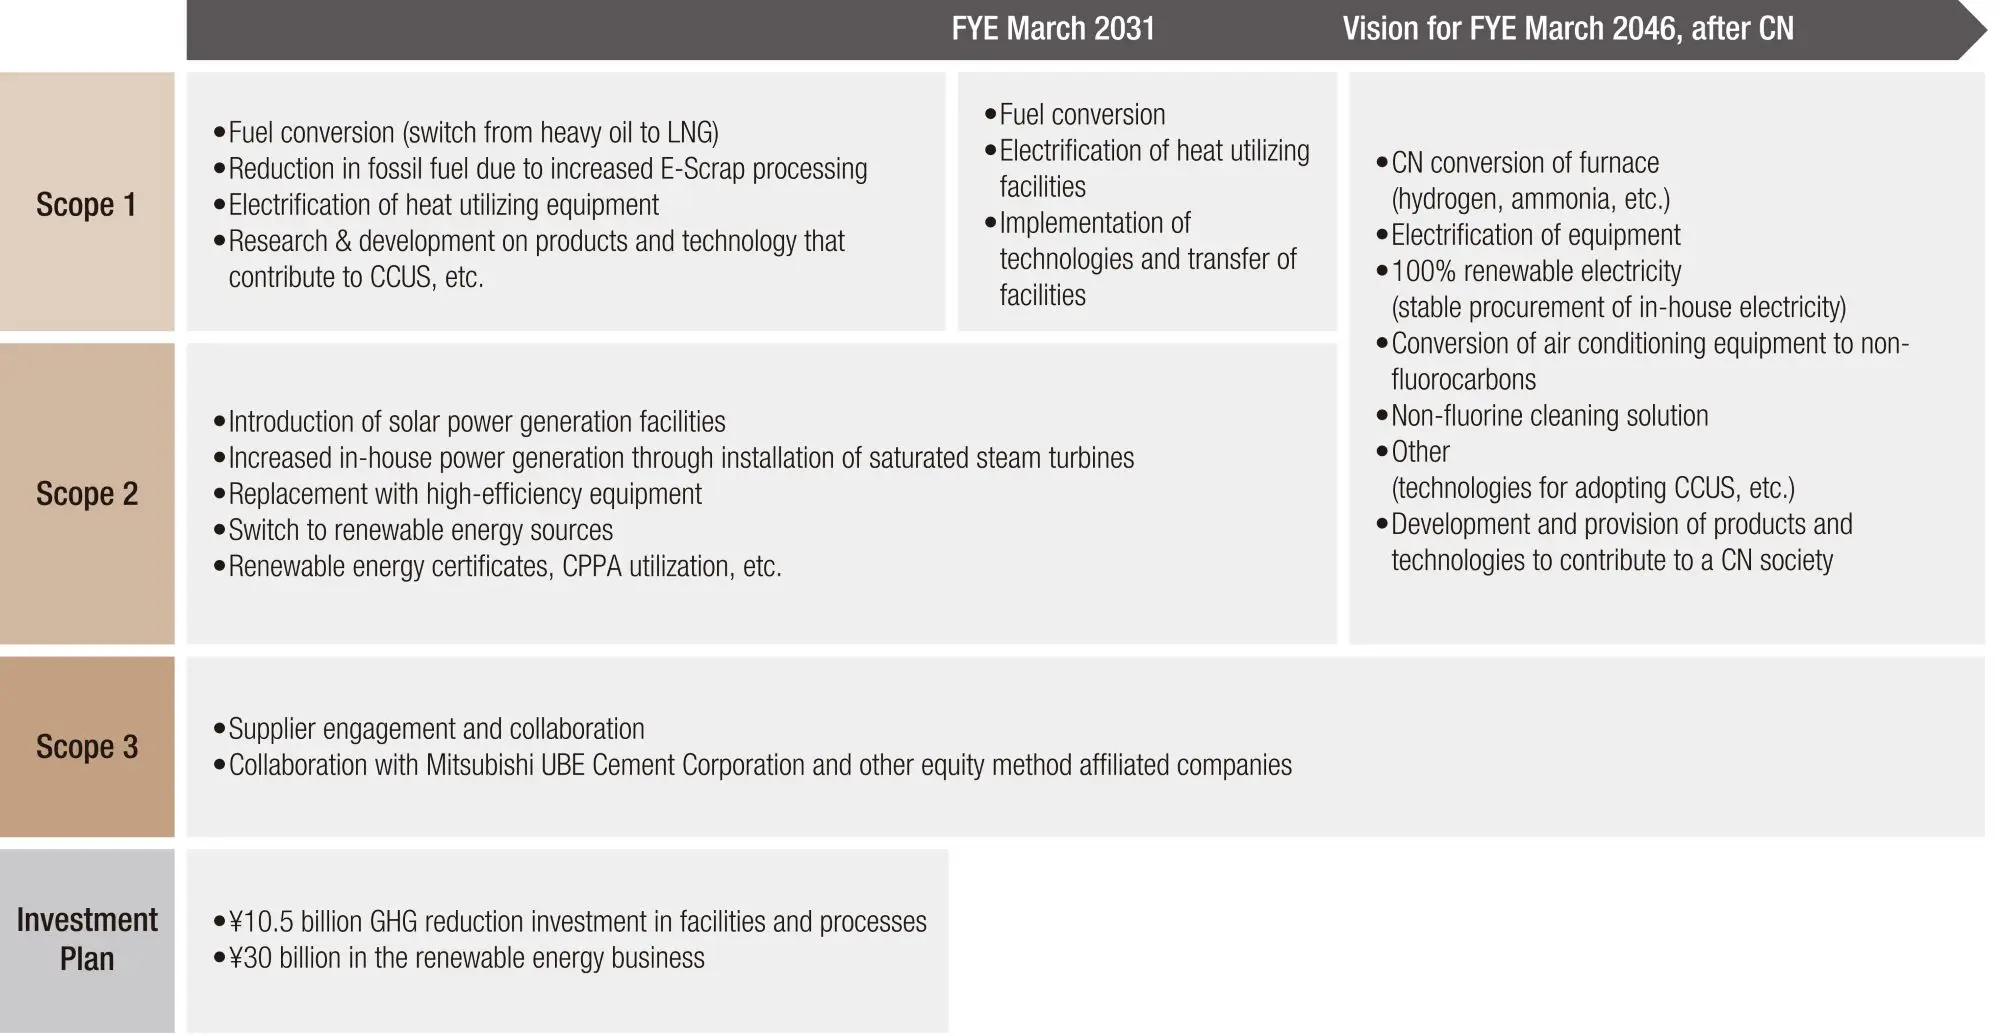
To achieve these goals, we will invest ¥10.5 billion in energy-saving measures and facility improvements, mainly at manufacturing sites, and ¥30 billion in renewable energy projects by the fiscal year ending March 2031.We will continue advancing energy savings and reducing emissions from fossil fuels at our manufacturing sites. We will also develop products that contribute to a carbon-neutral society and technologies such as CO2 capture and processing. Furthermore, by utilizing available technologies and other measures, we aim to achieve carbon neutrality by fiscal year ending March 2046, including reductions in GHG emissions from resource circulation initiatives.
From the viewpoint that reduction of GHG emissions in our business supply chain is essential to achieve a CN society in 2050, we have set a target to reduce Scope 3 (emissions of other companies related to business activities other than Scope 1 and Scope 2) by at least 22% by 2030 compared to the fiscal year ended March 2021 (The reduction targets are for Categories 1, 3, and 15).
Ahead of adoption of the Kyoto Protocol in 1997, the Japan Mining Industry Association (of which Mitsubishi Materials is a member) formulated a Voluntary Environmental Action Plan to solve the issue of climate change. A further refinement of this plan was formulated starting in 2013 as the Action Plan for Low-Carbon Society, as part of continuing efforts to reduce CO2 emissions from non-ferrous smelting in Japan. Interests and expectations for the realization of carbon neutrality had been growing since the government had set a target of carbon neutrality by 2050 and to reduce GHG emissions by 46% (the industrial sector’s target is 38%) from the fiscal year ended March 2014 levels by the fiscal year ending March 2031. So, JMIA revised the "Commitment to a Low Carbon Society" to the "Carbon Neutrality Action Plan" in the fiscal year ended March 2021.
In the fiscal year ended March 2021, JMIA was almost able to achieve its target of reducing CO2 emissions per unit of production by 26% from the fiscal year ended March 1991 levels by the fiscal year ending March 2031. Therefore, JMIA reviewed the target with advice from the Industrial Structure Council in 2022. The latest target is below.
- Target Assumptions:
- 2030 production volume of 2.8 million tons (2.407 million tons in FYE March 2023)
- Target indicator will be CO2 emissions, and the base year will be FYE March 2014)
- Electricity CO2 emission factor (kg-CO2/kWh) will be used as the adjusted emission factor (receiving end).
- Target:
- Reduce CO2 emissions by 38% from FYE March 2014 levels by FYE March 2031.
- Reduce CO2 emissions by 38% from FYE March 2014 levels by FYE March 2031.
As JMIA’s CO2 reduction target is consistent with the Paris Agreement-based target advocated by the Japanese government, we will continue to take part in initiatives to achieve the association’s targets.
- Our GHG emissions are approximately 230kt-CO2e more in the fiscal year ended March 2021, the base year of the reduction target, and approximately 350kt-CO2e more in the fiscal year ending March 2031, the target year of reduction, compared to those who reported before the change in the operation of the Act on Promotion of Global.
- GHG emissions excluding GHG emissions from resource recycling efforts are calculated based on Act on Promotion of Global Warming Countermeasures.
- The contents of our efforts to reduce GHG emissions are the same as for the previous 45% reduction target, which was set for GHG emissions excluding GHG emissions from E-Scrap and limestone. Including GHG emissions derived from E-Scrap and limestone, the reduction rate is 30%.
For non-financial evaluation, each Executive Officer is required to set three target items, one of which is a sustainability issue. Each item is broken down into two or three sub-items. The table below summarizes details of non-financial sub-items set for the fiscal year ending March 2025 in accordance with the Sustainability Policy, etc. In the fiscal year ending March 2025, we have set targets for five executive officers with respect to "Proactive Engagement for the Global Environment," which includes climate change performance.
|
Items in line with the Sustainability Policy |
Executive Officer |
|||||
|
A |
B |
C |
D |
E |
F |
|
|
Build a Work Environment that puts Safety and Health First |
〇 |
〇 |
||||
|
Respect for Human Rights |
〇 |
|||||
|
Promote Diversity, Equity & Inclusion |
〇 |
〇 |
〇 |
〇 |
〇 |
〇 |
|
Cultivate Mutual Prosperity with Stakeholders |
〇 |
〇 |
||||
|
Strengthen Corporate Governance and Risk Management |
〇 |
|||||
|
Engage in Fair Business Transactions and Responsible Sourcing |
〇 |
|||||
|
Ensure Stable Provision of Safe, Secure, and High Value Added Products |
〇 |
|||||
|
Proactive Engagement for the Global Environment |
〇 |
〇 |
〇 |
|||
The Company established the Transition-Linked Finance Framework in November 2023 (Revised in August 2024 due to changes in setting GHG emission reduction targets) to promote our efforts to achieve carbon neutrality. Based on the framework, we are issuing Transition-Linked Bonds and executing Transition-Linked Loans.
We will promote our efforts to achieve carbon neutrality by utilizing the funds raised.
For more information, see “Sustainable Financing.”
CFP*8 calculations are attracting increasing interest from various sectors, such as governments and industry associations in Japan and abroad, exploring calculation and utilization methods.
Under these circumstances, we will promote our CFP activities in accordance with the following directions.
We will sequentially promote the calculation of CFP for the main products we manufacture.
We will start building a system to ensure data reliability.
We will promote verification and disclosure of products for which CFP quantification has been completed by a third-party organization as necessary.
We will systematically implement our GHG reduction measures to reduce CFP.
We will promote engagement with suppliers and promote consistent GHG reduction efforts from upstream to downstream.
- Calculation and disclosure of greenhouse gas emissions throughout the product and service lifecycle.
Introduction of Internal Carbon Pricing (ICP) System MMC introduced an internal carbon pricing (ICP) system in April 2024 in order to raise awareness about GHG emissions and further promote its decarbonization efforts. Under the ICP system, the Company sets its own hypothetical price for GHG emissions and uses it for investment decisions.
The internal carbon price is set at ¥10,000 per t-CO2e and is used in investment decisions for capital expenditures that contribute to reductions in our own GHG emissions (Scope 1 + 2). We will actively promote the reduction of GHG emissions by promoting investments that contribute to decarbonization through the introduction of the ICP system.
The financial impact on the Group will be in the form of additional costs incurred in depending on the amount of greenhouse gas emissions, such as when policies and legal regulations on climate change are toughened, and carbon pricing systems (the emissions trading system and carbon tax) are introduced and strengthened. With the global shift to decarbonized societies, certain product markets in which the Group has traditionally been participating are expected to shrink. Any delay in taking action in new expanding markets could adversely affect the Group's results and financial position. The world is currently transitioning rapidly toward a carbon-neutral society based on the Paris Agreement. We believe we need to provide new value by responding quickly to these changes in the social environment.
Specifically, we will continue to steadily reduce greenhouse gas emissions from Group business activities by setting greenhouse gas reduction targets, introducing energy-saving equipment, and expanding the use of renewable energy. Furthermore, in order to improve the market competitiveness of Group products, we are enhancing our production processes and developing environmentally friendly products.
Physical risks - including damage from intensified acute water risks thought to be related to climate change such as superstorms, floods, storm surges, or drought, as well as chronic risks - are covered by Group-wide risk management activities.
Meanwhile, opportunities arising due to climate change include an expected increase in demand for technologies, products and services that contribute to energy saving and the reduction of greenhouse gas emissions due to the toughening of climate change policies and other measures. The Group takes initiatives such as the manufacturing of materials and products that contribute to decarbonization, the recycling of nonferrous metal resources, the development and promotion of the use of renewable energy such as geothermal power, the development of technologies related to CO2 capture and effective utilization, and conservation activities for the forest land we own. Through these initiatives, we aim to create both economic and social value.
In March 2021, the Group established and analyzed scenarios to ascertain the impact of climate change on the Group's business operations (risks and opportunities) and consider measures for reducing risks and securing opportunities. In February 2023, we updated the scenario analysis and set indicators and targets, while ensuring consistency between transition risks and opportunities and the Medium-term Management Strategy FY2031. We will monitor the situation based on the indicators and targets. We are updating the analysis of physical risks and examining indicators and targets.
|
Identify risks and opportunities |
Identify transition risks and opportunities and physical risks as climate change risks and opportunities relating to business operations |
|
|
|
||
|
Identify key risk and opportunity factors |
Consider the impact of identified risks and opportunities on business operations, their relationship to business strategies and their level of interest to stakeholders, etc., and identify risks and opportunities with a high degree of importance |
|
|
|
||
|
Analyze impact on business operations |
Analyze the degree of impact of key risks and opportunities on business operations In analyses and evaluations, we use a 1.5℃ scenario and a 4℃ scenario. |
|
|
|
[Reference scenarios] |
International Energy Agency (IEA): Net Zero Emissions by 2050 Scenario (NZE), Stated Policies Scenario (STEPS) Intergovernmental Panel on Climate Change (IPCC): Shared Socioeconomic Pathways (SSP), Representative Concentration Pathways (RCP), etc. |
|
Examine measures, indicators and targets |
Consider measures to reduce risks and secure opportunities Set the indicators and targets (such as GHG emissions reduction targets) to be monitored |
|
|
1.5℃ Scenario (the world moving toward carbon neutrality in 2050) |
4℃ Scenario (the world as it is and the world in which things are allowed to take their course) |
|
A scenario that charts out a path for the world's energy sector to follow to achieve net zero CO2 emissions by 2050. The scenario envisages the world where the social changes necessary for the establishment of a carbon free society and holding the rise in the global average temperature to 1.5℃ or less until the end of this century will impact business operations. [World as envisaged]
|
A scenario reflecting present the policies formulated based on an evaluating specific policies being implemented and policies announced by governments around the world by country or by sector. The scenario envisages the world as described below where the achievement of targets is not required and the global average temperature will rise about 4℃ by the end of the this century. [World as envisaged]
|
With regard to transition risks and opportunities related to climate change, we conducted scenario analysis for one theme across the Company and for three major themes for each business (total of nine minor themes). The external and internal data used in the analysis were updated.
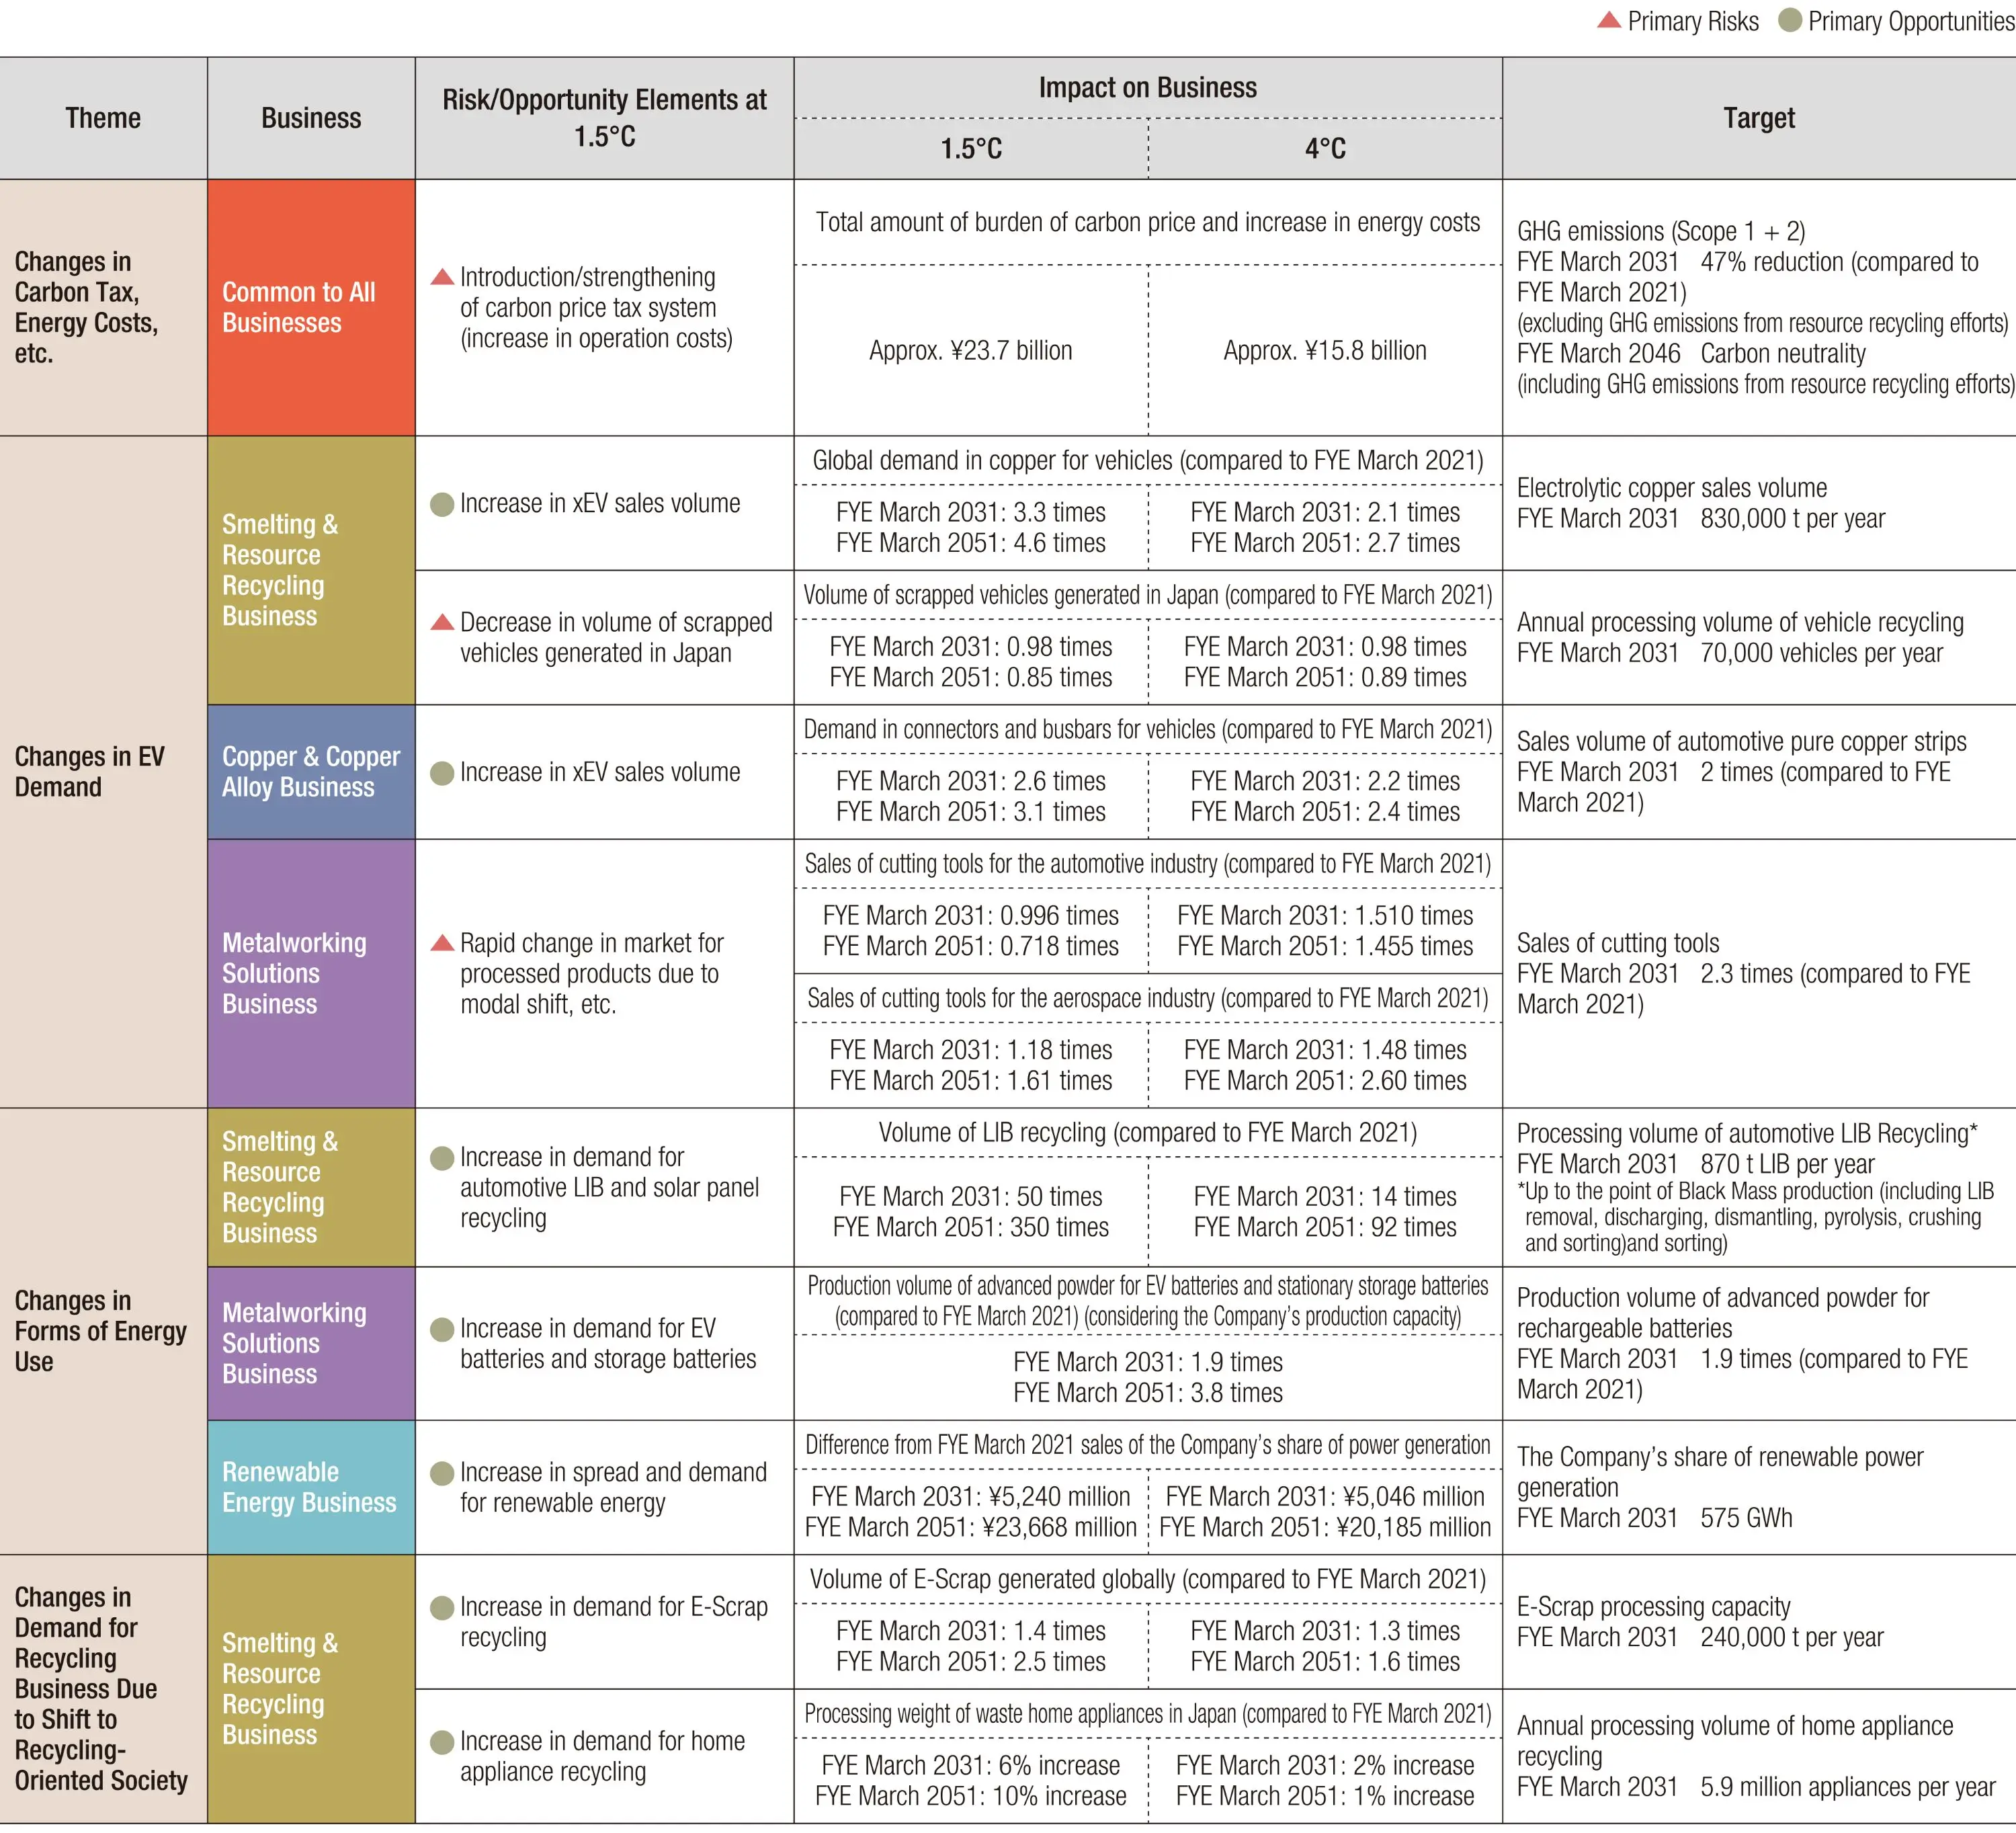
- 【1.5℃】Risk factor: Introduction/strengthening of carbon price tax system (increase in operation costs)
【4℃】Risk factor:Introduction of a Carbon Pricing Systems
|
Anticipated world and business impact |
【1.5℃】Increase in production costs due to introduction/strengthening of carbon price system
【4℃】Introduction of a Carbon Pricing Systems and Increased Production Costs due to Higher Unit Prices of Fuel
|
|
Impact analysis |
【1.5℃】If the Group achieves its GHG emission target, the CP burden in FYE March 2031 is estimated to be approximately ¥16.6 billion, and the rise in energy costs from FYE March 2021 is estimated to be ¥7.1 billion. Carbon pricing will be a factor contributing to cost increases for the Company While the impact of carbon pricing will extend to society overall, but if there are delays in reducing GHG emissions or the passing on of these costs to the price of Company products does not progress, then there is a risk that it may lead to a decrease in earnings.
【4℃】If the Group achieves its GHG emission target, the CP burden in FYE March 2031 is estimated to be approximately ¥8.3 billion, and the rise in energy costs from FYE March 2021 is estimated to be ¥7.5 billion. Compared with the 1.5°C scenario, the impact attributable to carbon prices is small, but combined with the increase in energy costs due to higher unit prices for fuel, it will be a factor increasing the Company's production costs. |
|
Indicator |
Group GHG emissions (Scope 1 + 2) |
Target |
|
|
Future Strategy and Response Toward a 1.5℃ World |
|
Total greenhouse gas emissions (Scope 1 + 2) declined by 25% compared with the fiscal year ended March 2024 to 688 thousand t-CO2e★, as a result of progress switching to electricity from renewable energy sources.
- GHG emissions excluding those from the use of recycled resources.
- Emissions for each fiscal year were recalculated based on the consolidated scope as of the end of March 2025.
- 【1.5℃】Opportunity factor: Increase in xEV sales volume
【4℃】Opportunity factor: Increase in the Automobile Units Sold
|
Anticipated world and business impact |
【1.5℃】Rapid growth in copper demand due to increased EV sales aimed at decarbonization
【4℃】Despite a low percentage of xEVs, demand for copper rises due to an increase in the total automobile units sold
|
|
Impact analysis |
In the 1.5℃ scenario due to a significant increase in the sales volume of xEVs which use more copper than conventional automobiles, and in the 4℃ scenario due to an increase in total automobile sales volume, worldwide copper demand for automotive applications is predicted to significantly increase. This will be an opportunity to expand sales by strengthening production of copper cathode and capturing demand. |
|
Indicator |
Copper cathode sales volume |
Target |
End of FYE March 2031 |
|
Future Strategy and Response Toward a 1.5℃ World |
To meet growing copper demand, we will invest in facilities at our domestic bases and increase our copper ore processing volume by 1.3 times (Naoshima) and copper cathode sales volume by 1.4 times (overall business) from the current levels by FYE March 2031. This stable supply of copper cathode will contribute to realizing a decarbonized society. |
Sales volume for copper cathode in FYE March 2025 increased due to the enhancement of the processing capacity of Gresik Smelter & Refinery of PT. Smelting.
- 【1.5℃,4℃】Risk factor: Decrease in the number of scrapped vehicles
|
Anticipated world and business impact |
【1.5℃】Decrease in the number of scrapped vehicles due to the decline in the Japanese population and the advance of car sharing in a decarbonized society
|
|
Impact analysis |
1.5℃ and 4℃ scenarios also, the number of vehicles processed in Japan is expected to decline, and there is a risk that automobile recycling sales will decline. However, in the 1.5℃ scenario, the trend in market size contraction will be moderated by the sharp rise in prices of valuable metals. |
|
Indicator |
Annual number of vehicles processed (thousand units/year) |
Target |
End of FYE March 2031 |
|
Future Strategy and Response Toward a 1.5℃ World |
|
The annual number of vehicles processed in the fiscal year ended March 2024 was 9,100 units, around the same number as the fiscal year ended March 2023, reflecting the ongoing impact of sharply rising prices of second-hand vehicles and a reduction in vehicles delivered from dealerships.
- 【1.5℃】Opportunity factor: Increase in xEV sales volume
【4℃】Opportunity factor: Increase in Automobile sales volume
|
Anticipated world and business impact |
【1.5℃】Rapid growth in demand for EV-related products for decarbonization
【4℃】Despite a low percentage of xEVs, demand for products rises due to an increase in the total automobile units sold
|
|
Impact analysis |
In the 1.5℃ scenario, given a significant increase in the sales volume of xEVs which use more copper products than conventional automobiles, and in the 4℃ scenario due to an increase in total automobile sales volume, a significant expansion of demand for the Company's rolled copper products is predicted. This will be an opportunity to expand sales by strengthening production of related products and capturing demand. |
|
Indicator |
Sales volume of pure copper strips for vehicles (Compared to FYE March 2021) |
Target |
End of FYE March 2031 |
|
Future Strategy and Response Toward a 1.5℃ World |
|
Even though inventory was built up in expectation of growth in the area of EVs, it is estimated that the sales volume in the fiscal year ended March 2025 decreased 20% from the previous fiscal year, due to a slump in EV sales, which resulted in a shift to an inventory adjustment phase, in addition to a slowdown in sales of automobiles mainly reflecting the fraud conducted by some Japanese OEMs. In the fiscal year ending March 2026, inventory adjustment will be completed, and demand is expected to increase due to electrification.
- 【1.5℃】Risk factors: Rapid change in market for processed products due to modal shift, etc.
【4℃】Opportunity factor: Increased production volume of engine-powered vehicles and aircraft
|
Anticipated world and business impact |
【1.5℃】Decrease in demand for cutting tools for engines due to increase in EV ratio
【4℃】Increased demand for cutting tools due to higher production volume of engine-powered vehicles and aircraft
|
|
Impact analysis |
【1.5℃】As there is an accelerating shift toward electric motors and lighter weights in the automotive industry and demand for the cutting tools used in the machining of difficult-to-cut materials is predicted to increase, there could be an opportunity for the Company to expand sales by revising its product mix and capture this demand. However, there is a risk that sales of cutting tools for the machining of engines and transmissions, currently mainstay products, will decrease, falling to 0.996 times that of FYE March 2021 levels by FYE March 2031 and to 0.718 times FYE March 2021 levels by FYE March 2051.
【4℃】As production volume of engine-powered vehicles and aircraft is predicted to rise due to a lack of progress in modal shift and EV shift, there will be an opportunity to increase sales of cutting tools for the automotive and aerospace industries, which are key products. Compared with FYE March 2021 levels, net sales of cutting tools for the automotive industry are expected to increase by 1.71 times by FYE March 2031 and by 1.65 times by FYE March 2051, and net sales of cutting tools for the aerospace industry are expected to rise by 1.48 times by FYE March 2031 and 2.60 times by FYE March 2051. |
|
Indicator |
Sales of cutting tools (Compared to FYE March 2021) |
Target |
End of FYE March 2031 |
|
Future Strategy and Response Toward a 1.5℃ World |
|
Sales of cutting tools in the fiscal year ended March 2025 increased 4.3% from the fiscal year ended March 2024, despite a global slowdown of demand, chiefly due to price increases and sales expansion measures.
- 【1.5℃,4℃】Opportunity factor: Increase in demand for automotive LIB and solar panel(PV) recycling
|
Anticipated world and business impact |
【1.5℃】Recycling demand will expand for automotive LIBs and PV waste generated on rapidly increased
【4℃】Recycling demand will expand for automotive LIBs and PV waste generated on increased
|
|
Impact analysis |
1.5℃ and 4℃ scenarios also, due to increased demand for EVs and solar power generation, it is anticipated that the emissions of automotive LIBs and PVs will increase at Japan in the future, and that the demand for recycling will increase accordingly. This will be an opportunity to increase sales by promoting commercialization based on demonstration tests currently underway. |
|
Indicator |
Amount of automotive LIBs recycled*7 |
Target |
End of FYE March 2031 |
|
Future Strategy and Response Toward a 1.5℃ World |
|
-
Up to the point of black mass production (including LIB removal, discharging, dismantling, pyrolysis, crushing, and sorting).
We have continued to develop technologies aimed at building the business infrastructure for LIB dismantlement and the production of black mass, including the use of robots to automate the LIB unit dismantlement process. Going forward, while it is expected that there will be many different waste automotive LIB units, we will establish technologies to safely and efficiently perform the proper processing of waste LIB units, in our efforts to establish a recycling-oriented society.
- 【1.5℃,4℃】Opportunity factor: Increase in demand for EV batteries and storage batteries
|
Anticipated world and business impact |
【1.5℃】Growing demand for tungsten powder due to rapidly increase in EV batteries and stationary storage batteries
【4℃】Growing demand for tungsten powder due to increase in EV batteries and stationary storage batteries
|
|
Impact analysis |
In the 1.5℃ scenario, the growing demand for EVs and the rapid increase in demand for storage batteries are expected to significantly increase demand for high-performance powders for rechargeable batteries. Even in the 4℃ scenario, EV demand and storage battery demand will increase, albeit to a small extent. 1.5℃ and 4℃ scenarios also, this will be an opportunity to increase sales by capturing demand through the expansion of our production capacity for tungsten-based high-performance powder. Sales of high-performance powder is expected to increase to 1.9 times FYE March 2021 levels by FYE March 2031 and to 3.8 times FYE March 2021 levels by FYE March 2051, due to the Company achieving its manufacturing plans. |
|
Indicator |
Production of high-functional powder for rechargeable batteries |
Target |
End of FYE March 2031 |
|
Future Strategy and Response Toward a 1.5℃ World |
|
The manufacturing volume of high-performance powders for rechargeable batteries in the fiscal year ended March 2025 increased 3.8% from the fiscal year ended March 2024 due to the steady growth of the global rechargeable battery market.
- 【1.5℃,4℃】Opportunity factor: Increase in spread and demand for renewable energy
|
Anticipated world and business impact |
【1.5℃】Medium- and long-term expansion of the renewable energy market toward a net-zero society Demand for renewable energy is expected to keep growing, with Japan's geothermal and wind power generation projected to increase 4.7-fold and 9.8-fold, respectively, by FYE March 2031 and 15-fold and 48-fold, respectively, by FYE March 2051, compared to FYE March 2021. Given the status of renewable energy uptake and the relationship between supply and demand, environmental value is set at between 0.3-4 yen per kWh, with unit prices for FIT/FIP declining by 10% over three years. 【4℃】Renewable energy demand will expand due to the implementation of current policies, but to a limited extent. Demand for renewable energy is expected to keep growing, with Japan's geothermal and wind power generation projected to increase 2.3-fold and 5.0-fold, respectively, by FYE March 2031 and 4-fold and 7.5-fold, respectively, by FYE March 2051, compared to FYE March 2021. Assuming limited demand for renewable energy, environmental value is set at 0.3 yen, with unit prices for FIT/FIP declining by 5% over three years to encourage demand. |
|
Impact analysis |
While the unit price of electricity sold and environmental value will fluctuate due to environmental policies and the advance of technology, under both the 1.5℃ and 4℃ scenarios renewable energy demand itself will expand, and in particular the growth rate of demand for wind power generation and geothermal power generation will be higher than other renewable energy sources. Researching and developing new power generation sites represents an opportunity for the Company to expand its renewable energy business. By achieving its plans for retained power generating capacity, the Company expects to increase sales by ¥5,240 million by FYE March 2031 and ¥23,668 million by FYE March 2051 compared with FYE March 2021 levels under the 1.5℃ scenario, and by ¥5,046 million by FYE March 2031 and ¥20,185 million by FYE March 2051 compared with FYE March 2021 levels under the 4℃ scenario. |
|
Indicator |
Our share of renewable energy sales volume |
Target |
End of FYE March 2031 |
|
Future Strategy and Response Toward a 1.5℃ World |
|
In the fiscal year ended March 2025, our share of energy sales was 98.3% of what it had been in the previous fiscal year due to a decrease in the volume of hydro power generated, which was a result of a decrease in rainfall.
- The amount of electricity sent from each power plant is totaled as the amount of equity power purchase.
- Including power consumed within the Company for the construction of the new Komatagawa Power Plant from the FYE March 2021 to the FYE March 2023.
- 【1.5℃,4℃】Opportunity factor: Increase in demand for E-Scrap recycling
|
Anticipated world and business impact |
【1.5℃】Increase in demand for recycling waste electronic equipment in line with economic growth in each country
【4℃】Increase in demand for recycling waste electronic equipment in line with economic growth in each country
|
|
Impact analysis |
Due to economic growth in each country and worldwide population growth under the 1.5°C scenario, and due to worldwide population growth under the 4℃ scenario, global E-scrap generation in FYE March 2031 will increase. There is a risk of a decline in the grade of valuable metals in E-Scrap leading to a decrease in the amount recovered, and a risk of difficulties in collecting E-Scrap due to successive entries into the E-Scrap market by competitors and international moves to lock in resources. However, increasing our recycling capacity will increase our E-Scrap processing volume and provide an opportunity to increase our sales. |
|
Indicator |
E-Scrap processing capacity |
Target |
End of FYE March 2031 |
|
Future Strategy and Response Toward a 1.5℃ World |
|
E-scrap processing capacity in the fiscal year ending March 2025 remained unchanged from the fiscal year ended March 2021 level at 160,000 tons. To reach our target processing capacity of 240,000 tons by the fiscal year ended March 2031, we plan to carry out construction to expand processing capacity at Naoshima in the fiscal year ending March 2027.
- 【1.5℃,4℃】Opportunity factor: Increase in demand for home appliance recycling
|
Anticipated world and business impact |
【1.5℃】The amount of home appliance waste processed will increase due to the rising frequency of energy-efficient home appliance upgrades in response to global warming and rising energy costs
【4℃】Slight increase in waste home appliance disposal weight due to increase in air conditioner ownership linked to rising temperatures and a higher frequency of breakdowns and replacement
|
|
Impact analysis |
【1.5℃】Given fluctuations in home appliance ownership due to changes in the number of households in Japan, and an increase in the home appliance recovery rate attributable to recycling regulations and other factors, it is estimated that the total volume of disposed home appliances across Japan will increase by 6% compared with FYE March 2021 levels by FYE March 2031, and by 10% compared with FYE March 2021 levels by FYE March 2051. There is an opportunity to increase sales by scaling up the Company's home appliance disposal business. 【4℃】With increased air conditioner ownership linked to rising temperatures and a higher frequency of breakdowns and replacements due to wind and flood damage, it is estimated that the total volume of disposed home appliances across Japan will increase by 2% compared with FYE March 2021 levels by FYE March 2031, and by 1% compared with FYE March 2021 levels by FYE March 2051. There is an opportunity to increase sales by scaling up the Company's home appliance disposal business. |
|
Indicator |
Annual number of home appliances processed |
Target |
End of FYE March 2031 |
|
Future Strategy and Response Toward a 1.5℃ World |
|
In the fiscal year ended March 2025, the number of units received continued to trend downward overall, as it did in the previous fiscal year, but the total number of home appliances processed remained almost flat at 3.52 million units, partly reflecting the ongoing increase in the air conditioner recovery rate.
The GHG emissions (Scope 1 + 2) for the entire Group in the fiscal year ended March 2025 were 688 thousand t-CO2e★. As a result of the switch to electricity derived from renewable energy sources, GHG emissions decreased by 15 thousand t-CO2e from the fiscal year ended March 2024.
The breakdown of GHG emissions was 42% by the parent company, 48% by domestic Group companies, and 10% by overseas Group companies.
- GHG emissions excluding those from the use of recycled resources.
- Emissions for each fiscal year were recalculated based on the consolidated scope as of the end of March 2025.
In the fiscal year ended March 2025, GHG emissions by business segment were 66% in Metals business, 9% in Metalworking Solutions business, 24% in Advanced Products business, and 1% in Other business.
- GHG emissions excluding those from the use of recycled resources.
- Emissions for each fiscal year were recalculated based on the consolidated scope as of the end of March 2025.
Total GHG emissions for the fiscal year ended March 2025 was 1,111 t-CO2e★, including GHG emissions from resource circulation initiatives .
GHG emissions from energy sources accounted for 24% of total GHG emissions, and GHG emissions from resource circulation initiatives accounted for 38%.
|
Category |
Non-consolidated |
Domestic Group companies |
Overseas Group companies |
Total |
|
|
Scope 1 |
From energy sources (fuel, etc.) |
94 |
143 |
25 |
263 |
|
From non-energy sources |
31 |
71 |
0 |
102 |
|
|
GHG emissions from resource recycling efforts |
161 |
261 |
0 |
422 |
|
|
Scope 1 total |
286 |
475 |
26 |
★787 |
|
|
Scope 2 |
149 |
98 |
77 |
★324 |
|
|
Total |
435 |
573 |
102 |
★1,111 |
|
- “Group companies” includes 85 consolidated subsidiaries (31 domestic, 54 overseas).
- As emission factors, the adjusted emission factor of power companies was used for power in Japan, the emission factor published by the International Energy Agency (IEA) was used for power in other countries, and values based on the Act on Promotion of Global Warming Countermeasures were used for fuels and steam.
- Scope 2 (Indirect) emissions are market-based emissions. Location-based Scope 2 emissions are 312 kt-CO2e.
|
Item |
Object |
Non-consolidated |
Group |
Total |
Approach to determining the amount of activity |
|
|
Category 1 |
Purchased goods and services |
Same as organizations covered by environmental data other than greenhouse gas emissions |
737 |
1,448 |
2,185 |
The use of raw materials accepted from outside the Group (excluding waste as raw materials and by-products as raw materials) and water intake in terms of physical quantity |
|
Category 2 |
Capital goods |
Same as consolidated financial statements |
99 |
103 |
203 |
Capital expenditure in the reportable fiscal year |
|
Category 3 |
Fuel and energy-related activities not included in Scopes 1 and 2 |
Same as organizations covered by data on greenhouse gas emissions |
59 |
70 |
130 |
Fuel consumption by type and volume of electric power and steam purchased from outside the Group |
|
Category 4 |
Upstream Transportation and Distribution |
Same as organizations covered by environmental data other than greenhouse gas emissions |
223 |
325 |
548 |
1) Emissions from the physical distribution of products and services, which were purchased in the reportable fiscal year, from suppliers to the company |
|
Category 5 |
Waste generated from operations |
Same as organizations covered by environmental data other than greenhouse gas emissions |
3 |
14 |
17 |
The amount of industrial waste (waste recycled into resources and landfilled waste) was included. |
|
Category 6 |
Business Travel |
Consolidated |
1 |
2 |
2 |
For non-consolidated the number of employees at each base (plants and offices). For consolidated subsidiaries, the number of employees of each in-house Company from human resources information given in the securities report. |
|
Category 7 |
Employee commuting |
Consolidated |
2 |
5 |
7 |
For Mitsubishi Materials (non-consolidated), the number of employees at each base (plants and offices) was used for the calculation. For consolidated subsidiaries, the number of employees of each in-house company from human resources information given in the securities report was used for the calculation. |
|
Category 8 |
Upstream Leased Assets |
ー |
ー |
ー |
ー |
While there are leased assets, they were excluded from the calculation because they are included in Scope 1 and Scope 2. |
|
Category 9 |
Downstream Transportation and Distribution |
Same as organizations covered by environmental data other than greenhouse gas emissions |
32 |
32 |
64 |
Emissions from physical distribution of products that were shipped and transported to sales destinations at the expense of other companies Transportation from sales destinations to final consumers was excluded. Distances between countries were set by using the IDEA database on distances between countries, and other distances were set by using a distance search site (with the distance given by an in-house company in a questionnaire adopted in some cases). |
|
Category 10 |
Processing of sold products |
Same as organizations covered by environmental data other than greenhouse gas emissions |
168 |
234 |
402 |
For products sold, the value for the amount of products shipped by each in-house Company to companies other than group companies was regarded as the value for the amount of activity. Emissions from processing were calculated by setting the primary processing assumed for each product. |
|
Category 11 |
Use of sold products |
ー |
ー |
ー |
ー |
Products sold were excluded from the calculation because they are materials and parts that are used by a wide range of users and it is therefore difficult to follow their paths to final products. |
|
Category 12 |
End-of-Life Treatment of Sold Products |
Same as organizations covered by environmental data other than greenhouse gas emissions |
2 |
3 |
5 |
For products sold, the value for the amount of products shipped by each in-house Company to companies other than Group companies was regarded as the value for the amount of activity. Emissions from disposal were calculated by setting a disposal method assumed for each product. |
|
Category 13 |
Downstream Leased Assets |
ー |
ー |
ー |
ー |
Leased assets were excluded because virtually no such asset is owned. |
|
Category 14 |
Franchises |
ー |
ー |
ー |
ー |
Franchising business was excluded because the company does not operate such a business. |
|
Category 15 |
Investments |
Affiliates accounted for by the equity method |
5,410 |
0 |
5,410 |
Scope 1 + 2 emissions and share of Scope 1 + 2 emissions of equity method affiliates in the reporting year |
|
Total |
★6,738 |
2,235 |
★8,973 |
|||
- Raw material procurement, transportation, and product shipment scenarios were set based on the fiscal year ended March 2022 results.
- The calculation was made by referring to the Basic Guidelines on Accounting for Greenhouse Gas Emissions Throughout the Supply Chain Ver. 2.6 from the Ministry of the Environment and the Ministry of Economy, Trade and Industry. Greenhouse gas emissions per unit was calculated by referring to the emission intensity database for calculating greenhouse gas emissions of an organization through the supply chain (Ver. 3.4) and National Institute of Advanced Industrial Science and Technology IDEA Ver. 3.4 from the above ministries.
- Scope 3 emissions for the fiscal year ended March 2025 reflect data on Mitsubishi Materials Corporation and 47 consolidated subsidiaries as of March 31, 2025.
We regard it as a top priority to save energy wherever possible at our manufacturing facilities and plants. That is why we are so committed to energy saving activities. Specific activities include switching fuels, making effective use of untapped energy, upgrading processes and equipment, installing high-efficiency equipment, optimizing device specifications, and reviewing equipment controls and operating practices. We are constantly working to save energy at smaller facilities, too, including Head Office, branches, sales offices and research facilities, through measures such as installing LED lighting.
We have set a reduction target for Scope 3 (Categories 1, 3, and 15) of GHG emissions of 22% below the fiscal year ended March 2021 level by the fiscal year ending March 2031. We are building relationships with our suppliers to reduce GHG emissions throughout our supply chain. Specifically, we send questionnaires to copper concentrate suppliers related to category 1, which accounts for approximately 24% of Scope 3 emissions (actual emissions in FYE March 2025), based on reports published regarding the status of the actions taken to address global environmental issues and GHG reduction targets and plans, and receive responses from them. We engage in two-way communication with them in this way. We also exchange opinions with them during online meetings and push forward with initiatives to reduce GHG emissions throughout the supply chain. In the fiscal year ended March 2025, questionnaires were sent to suppliers accounting for approx. 90% of the copper concentrate that we procure. The Company plans to continue these efforts and expand the suppliers that they apply to.
Among copper concentrate suppliers, we have also signed a Memorandum of Understanding (MOU) with Anglo American plc, a multinational mining company headquartered in London, UK, to promote collaboration for providing sustainable and responsible products throughout the copper-related products supply chain. As global demand for copper increases, there is a desire that those supplies be greener and more sustainable. The Company and Anglo American plc will work together to meet these market demands.
For more information on our efforts with suppliers in procurement through the Logistics and Materials Division, please refer to "Supply Chain Management."
Initiatives for Scope 3 Emissions Reduction
MUCC’s Efforts Towards Carbon Neutrality
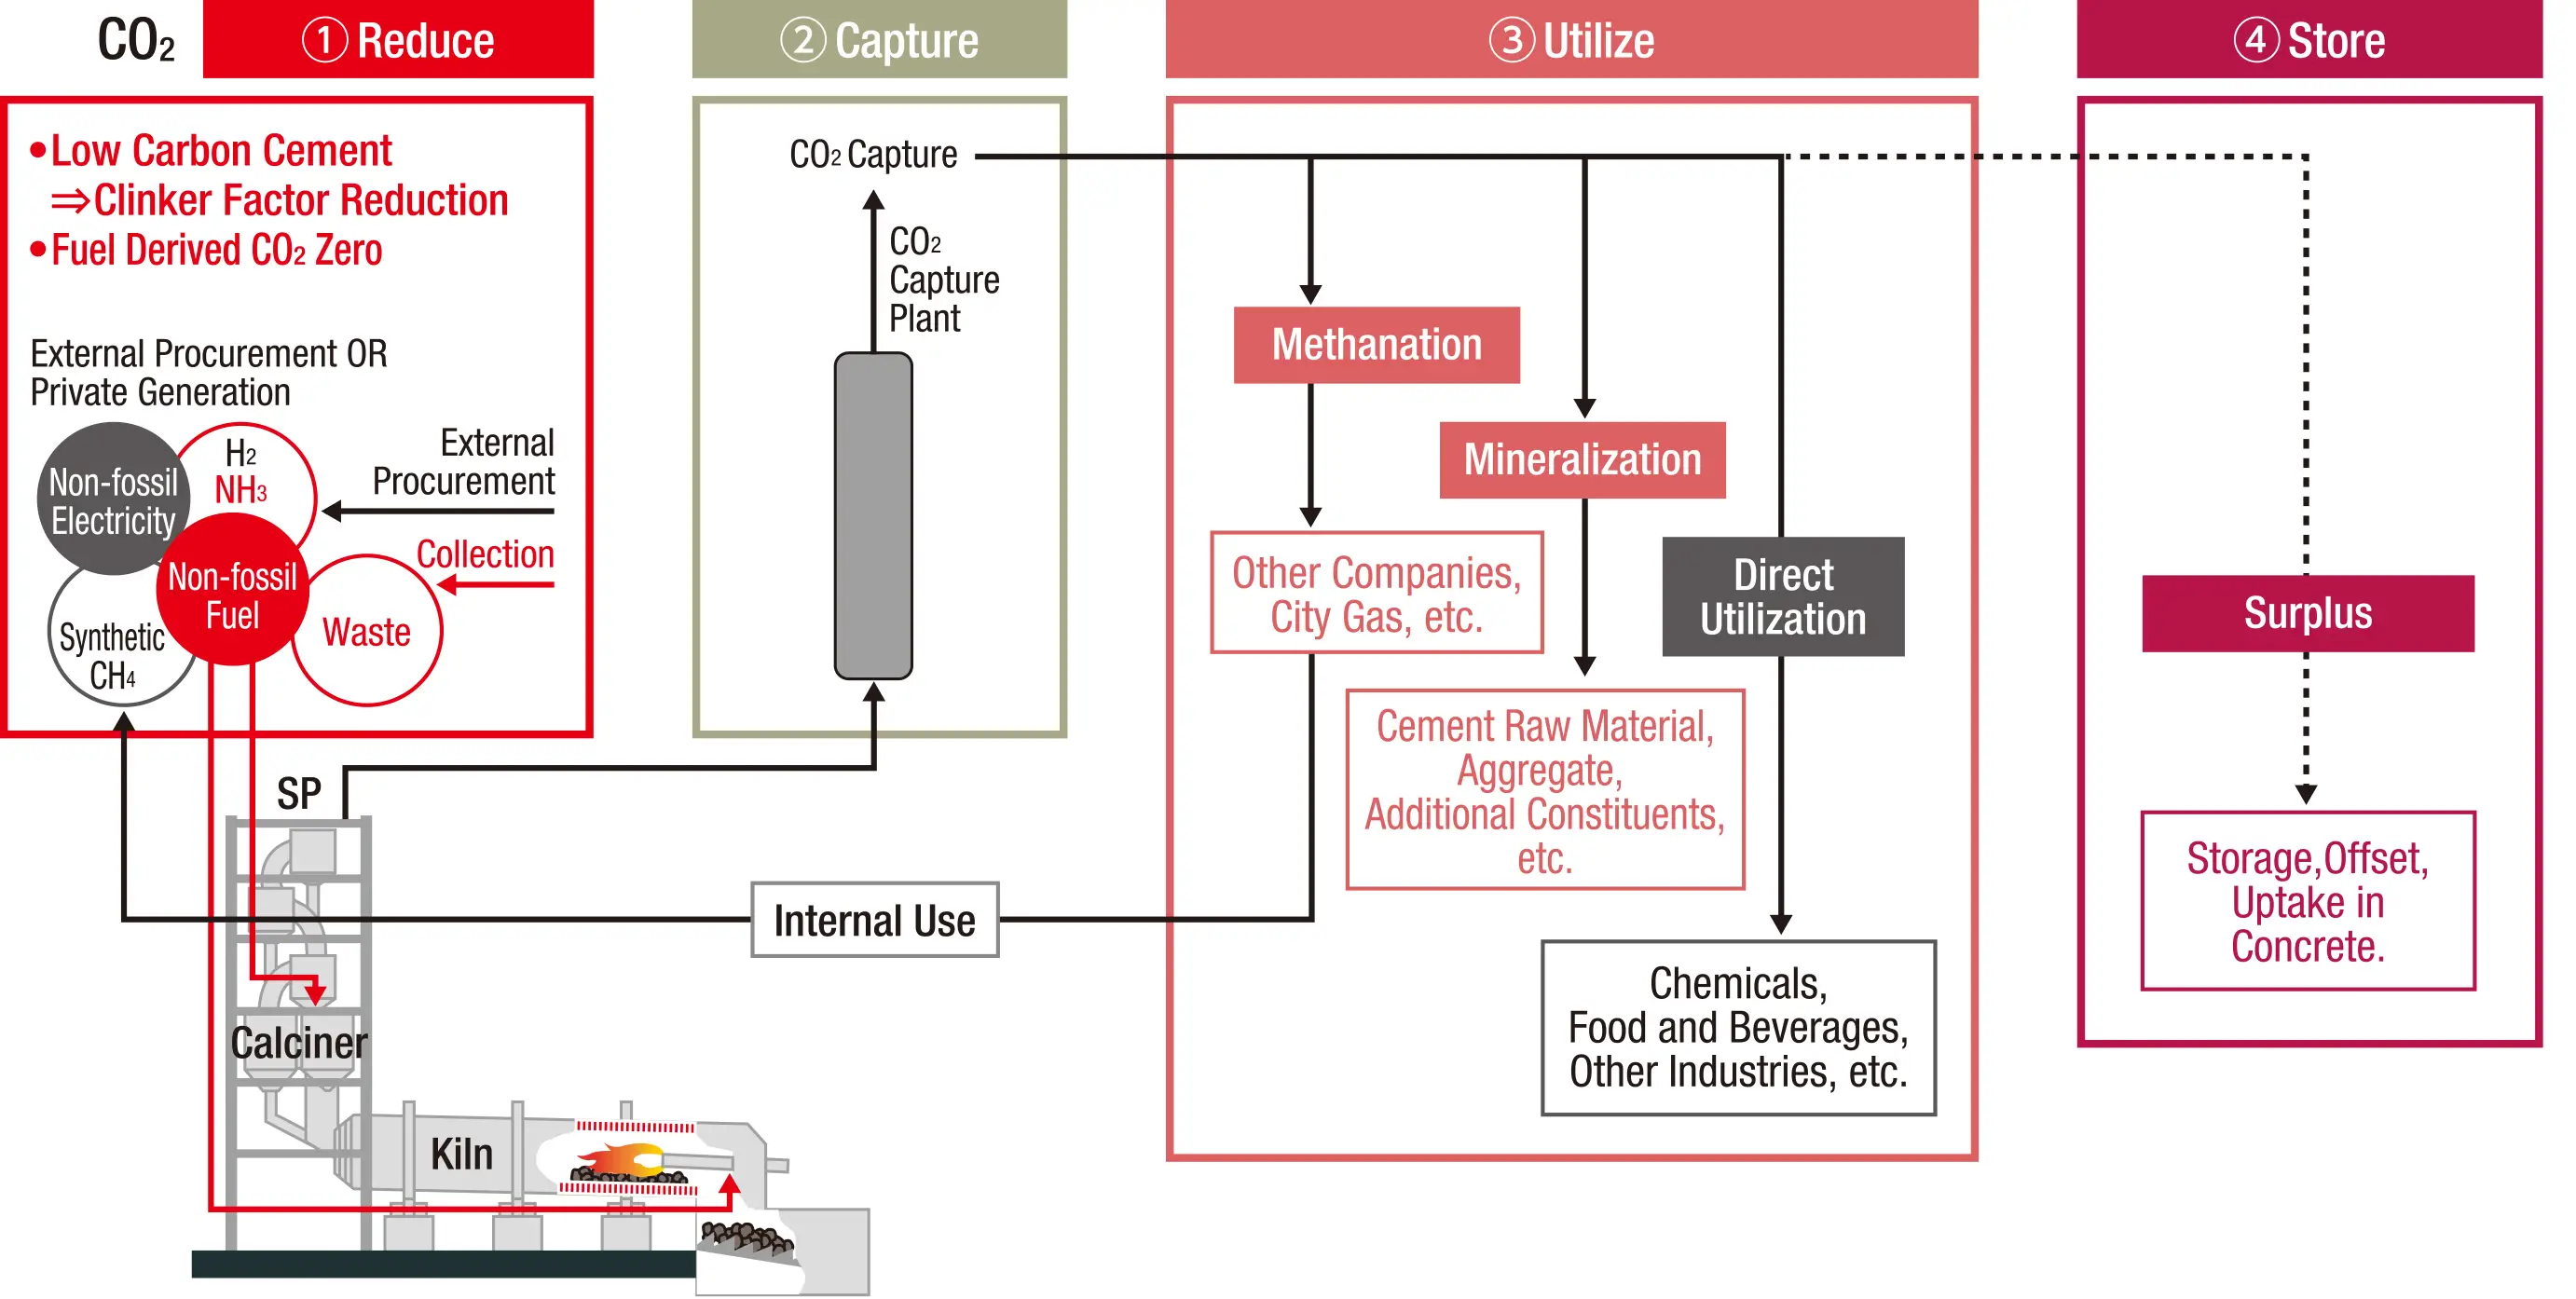
Mitsubishi UBE Cement Corporation (MUCC) is an equity method affiliate, and the Company counts and reports 50% (shareholding ratio of MUCC) of MUCC’s Scope 1 and 2 emissions as the Group’s Scope 3 category 15 emissions. As these emissions account for approximately 60% of Scope 3 emissions (as of the fiscal year ended March 2021), reducing MUCC’s emissions will contribute significantly to the Group’s Scope 3 emissions reduction. MUCC has set the “promotion of global warming countermeasures” as one of its top priorities in its Medium-term Management Strategy, “Infinity with Will 2025: MUCC Sustainable Plan 1st Step,” announced in April 2023. Under this trategy, MUCC is taking a variety of steps to achieve carbon neutrality by 2050 with the intermediate goal of reducing CO2 emissions by 40% by 2030 (compared to 2013 levels).
Regarding the reduction of CO2, MUCC has jointly developed an eco-friendly concrete that substitutes approximately 80% of the cement with blast-furnace slag with Shimizu Corporation. MUCC has now obtained certification from the Minister of Land, Infrastructure, Transport and Tourism, and is planning construction. In addition, in January 2025, MUCC commenced the world’s first commercial-scale demonstration test of ammonia co-firing in the cement manufacturing process. In August 2025, MUCC, Osaka Gas Co., Ltd., Daigas Energy Co., Ltd., and Saibu Gas Co., Ltd. successfully conducted a joint demonstration test of natural gas co-firing as a thermal energy source for a cement kiln of MUCC’s Kyushu Plant Kurosaki District. Using a newly developed natural gas co-firing burner, 40% of the coal used in the cement kiln was substituted with natural gas. Operation on a commercial scale confirmed no issues in terms of operational stability or product quality, and no environmental hazards were identified. This was Japan’s first attempt at using natural gas in a cement kiln in commercial operation, marking an important step toward becoming a low-carbon society. Switching to natural gas, a low-carbon energy source, at an earlier stage is under consideration, in order to reduce CO2 emissions during cement production. In the future, MUCC will also work on transitioning from natural gas to e-methane*.
Regarding the utilization of CO2, MUCC, in collaboration with Kitakyushu City, will conduct demonstration testing for a series of local production for local consumption model projects for use in the city. In these projects, MUCC will produce carbon recycling materials such as CO2-fixed recycled aggregate, base materials, and carbonate artificial sand on a demonstration scale by causing a reaction between CO2 emitted from cement plants and waste materials such as waste concrete or by-products emitted from chemical plants and steel mills, which are available nearby. Regarding carbonate artificial sand, MUCC has developed GX-e Beads™, a carbon-negative fine aggregate that fixes CO2 and is suitable for use in standard-strength concrete, employing it to carry out trial manufacture and test construction of interlocking blocks. In addition, MUCC has signed an investment and collaboration agreement with Australian start-up MCi Carbon Pty Ltd. (MCi), and a tripartite memorandum of understanding with MCi and ITOCHU Corporation to transform MUCC into a low-carbon business by utilizing MCi’s mineral carbonation technology, and to consider development and business models for the resulting mineral carbonation products.
Regarding the storage of CO2, MUCC has been commissioned for JOGMEC’s Advanced CCS Joint Feasibility Study for the Southern Malay Peninsula Offshore CCS Project, with the aim of making the cement manufacturing process carbon neutral. MUCC has conducted a feasibility study to establish a value chain encompassing CO2 separation, capture and underground storage, and has also initiated a joint study on carbon dioxide capture, utilization and storage (CCUS) with Osaka Gas Co., Ltd.
In order to reduce Scope 3 emissions, the Company will set up regular opportunities for dialogue to continue sharing information on the status of its efforts.
- E-methane is a synthetic methane produced from CO2 and hydrogen derived from renewable energy sources. Since burning e-methane does not result in a net increase of CO2 in the atmosphere, it is gaining attention as an energy source that contributes to achieving carbon neutrality.
Significantly Accelerating the Switch to Electricity Derived from Renewable Sources at Sites in the Metals Business
- Fully introduced at 80% of the sites in FYE March 2025 –
We have set a new GHG emissions reduction target (Scope 1 + 2) of 47% from levels of the fiscal year ended March 2021 by the fiscal year ending March 2031. This target excludes GHG emissions from resource recycling efforts. To achieve this goal, we are promoting energy saving and shifting to fuels that contribute to CO2 emissions reduction, as well as switching to electricity derived from renewable sources.
Electricity-origin emissions account for 38% (as of FYE March 2021) of the Group's total GHG emissions (excluding GHG emissions from resource recycling efforts).The Metals business, which accounts for approximately 60% of the Group's domestic electricity consumption, will further accelerate the switch to electricity derived from renewable energy sources among its purchased electricity, moving the completion of this plan forward by up to 11 years to the fiscal year ending March 2025 at 80% of its plants, and by 7 years to the fiscal year ending March 2029 at the Naoshima Smelter & Refinery and Onahama Smelter & Refinery.
CO2 emissions from transportation in the fiscal year ended March 2025 were 18,546 tons (down 64 tons from the fiscal year ended March 2024) on a non-consolidated basis and 5,758 tons (up 684 tons from the fiscal year ended March 2024) for Group companies. The total CO2 emissions of the parent Company and Group companies amounted to 24,304 tons (up 620tons from the fiscal year ended March 2024). Unit energy consumption* for the parent Company was 21.94 kℓ/million ton-kilometer (Improvement approximately 4.9% from the fiscal year ended March 2024), while the combined total of the parent Company and Group companies was 26.07 kℓ/million ton-kilometer (down approximately 13.2% from the fiscal year ended March 2024). We will continue to strive to save energy in transportation by promoting modal shifts and improving loading rates, and through Group-wide logistics optimization, we aim to build a logistics system that reduces environmental impact through the use of non-fossil energy.
|
FYE March 2024 |
FYE March 2025 |
|||||||
|
Mitsubishi Materials |
Group companies |
Total |
Mitsubishi Materials |
Group companies |
Total |
|||
|
CO₂ emissions from logistics |
Total |
18,610 |
5,074 |
23,684 |
18,546 |
5,758 |
24,304 |
|
|
Breakdown |
Trucks |
11,759 |
3,416 |
15,175 |
11,392 |
3,380 |
14,772 |
|
|
Ships |
6,800 |
1,655 |
8,455 |
7,103 |
2,374 |
9,477 |
||
|
Rail |
4 |
3 |
7 |
4 |
4 |
8 |
||
|
Air |
47 |
0 |
47 |
47 |
0 |
47 |
||
- Value obtained by converting energy consumption into crude oil (㎘) and dividing it by transportation in ton-kilometers (million ton-kilometers)
For the Group, tackling climate change has been one of its most important management issues for building a decarbonized society. Reflecting this, the Group has been approaching manufacturing with a view to reducing the environmental impact and has developed and promoted the use of renewable sources of energy, such as geothermal energy.
Construction of a Pilot Plant for the Establishment of Lithium-Ion Battery Recycling Technology
- Next Step to Commercialization of Rare Metal Refining from Black Mass –
Rare metals such as lithium, cobalt, and nickel, which are the materials used in LIBs, are expected to be in short supply in the near future, making them an important issue for growth strategies in the industry as a whole. To address the issue, in addition to the development of underground resources, measures are being taken to recycle materials and to develop alternative materials.
We have been developing technologies through small-scale tests to commercialize the recovery and refinement of rare metals such as lithium, cobalt, and nickel from Black Mass *9. Having achieved certain results, as a next step, we will build a pilot plant at Onahama Smelter & Refinery of Onahama Smelting and Refining Co., Ltd. in Iwaki City, Fukushima Prefecture to further develop technologies for the commercialization of high-efficiency recovery of rare metals from Black Mass.
The technical development associated with the construction of the pilot plant will be supported by a grant from the Ministry of Economy, Trade and Industry, which is related to its stable supply plan of critical minerals.
Raw materials:LIB derived Black Mass
Products:Battery-grade lithium carbonate, nickel sulfate, cobalt sulfate
Commencement of operation:2025
Location:On the site of Onahama Smelter & Refinery, Onahama Smelting and Refining Co., Ltd.
- Concentrated residue of lithium, cobalt and nickel sorted from LIBs that have been discharged, dried and crushed.
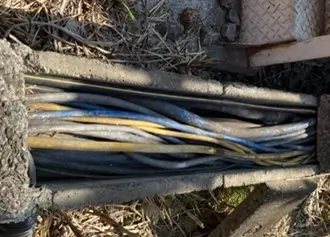
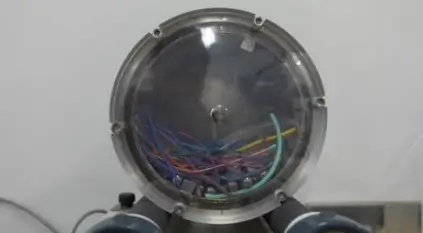
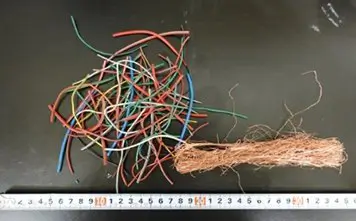
R&D on Recycling Used Cables Generated by Railroad Operations to Begin on April 1
- Aiming to establish a system for reducing waste by recycling copper and coating materials –
The four parties—Tohoku University (“Tohoku University”), Tokyu Corporation (“Tokyu”), Tokyu Railways Co., Ltd. (“Tokyu Railways”) and Mitsubishi Materials Corporation (“MMC”)—will commence research and development on the recycling of used cables generated by railroad operations (“R&D”) on Tuesday, April 1, 2025. This R&D has been selected for the FY2025 Environment Research and Technology Development Fund of the Environmental Restoration and Conservation Agency (ERCA) and will be carried out over three years, concluding in March 2028.
This R&D project uses cables from electrical facilities and signal cables along the tracks of Tokyu Railways, which are currently disposed of, as model cables to develop a combined plastic swelling and ball milling method (“Technology”) for separating the cables into copper wires and coating materials. This Technology applies the separation principle of plastic swelling followed by separation through moderate impact from ball milling*, a method that Tohoku University has pioneered and developed in collaboration with MMC. While the cables used in this project have excellent strength to withstand the harsh conditions typical of railroads, the coated wires are thin. Existing coated wire treatment technologies make it difficult to separately sort copper wire and the coating materials to a high purity. As a result, the materials that can be recovered as recyclable resources from used cables are limited. Tokyu Railways generates an average of approximately 10 tons of such used cables per year. We aim to recycle the copper wires and coating materials recovered using this Technology into recycled cables for use in the railroad industry, including Tokyu Railways. Furthermore, we will evaluate the ripple effects on the railroad industry in the future by quantifying the CO2 emission reductions and economic benefits brought about by recycling.
This R&D has been made possible through the collaboration of four parties: Tohoku University, which has pioneered the research and technological development of the combined plastic swelling and ball milling method for coated wires; Tokyu, which formulated its Environmental Vision 2030 in March 2022 to realize a decarbonized and recycling-based society and tackles waste reduction by 10% by 2030; Tokyu Railways, which aims to solve environmental and social issues through activities including new value creation and contribution leveraging its business characteristics to realize a decarbonized and recycling-based society through its railroad business; and MMC, which has advanced smelting and recycling technologies for copper and other nonferrous metals.
Through this R&D, cables from the railroad industry will be made recyclable as recycled cables, which can be applied not only to the railroad industry but also potentially to other industries in the future. Through this effort, we aim to establish a system that reduces and recycles waste as much as possible.
- Separating principle of the combined plastic swelling and ball milling method involves immersing cables in an organic solvent, which causes the coating materials to expand (swell). Impacting the cables in this state with small metal balls or balls made of other materials allows for the separation of copper wires and the coating materials without damaging them. This process is called the “combined plastic swelling and ball milling method.”